
A/B TESTING: COOKIE CATS MOBILE GAME
Analyzing the effect of changing the first time keeper in a puzzle mobile game

The objective of this article is to expose the main findings and conclusions found after analyzing a Cookie Cats Mobile game dataset. This dataset is originally from Datacamp, but has been published in Kaggle.
You can find all the code and analysis I have done on my github:https://github.com/manumg/A-B-TEST-Cookie-Cats-Game.
The structure of this article will be the following:
-Explain the basic structure of the game
-Describe the project objectives
-Report the main findings after cleaning and exploring the dataset
-Explain the A/B results and bootstrapping visualizations
-Conclusions
COOKIE CATS
Cookie Cats is a mobile puzzle game. As in the rest of the puzzle games (the most popular one is Candy Crush), in Cookie Cats the players advance through more difficult puzzle levels. As players progress through the game, they will encounter gates that force them to wait some time before they can progress or make an in-app purchase.

THE PROJECT
In this project, we are going to analyze the impact on engagement and retention of changing the first gate from level 30 to level 40. To test this change, we are going to apply an A/B test. What is an A/B test? It’s a random experimentation process where two or more versions of the same variable, in this case when introducing the first gate in the game, are presented to different segments of the players to determine which of them brings more benefits to the company.
Simply put, we introduce the new gate at level 40 to a randomly assigned group of players, and the rest of the players keep playing with the original version of the first gate at level 30. Once we have the groups split, we can start conducting our analysis.
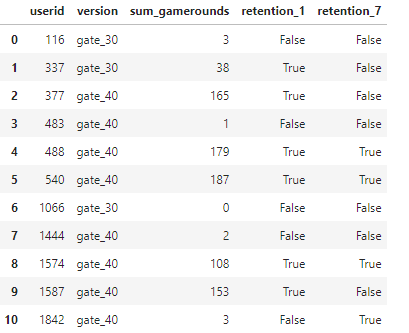
Dataset description: The data is from 90,189 players that installed the game while the AB test was running. The variables are:
-userid - a unique number that identifies each player.
-version - whether the player was put in the control group (gate_30 - a gate at level 30) or the test group (gate_40 - a gate at level 40).
-sum_gamerounds - the number of game rounds played by the player during the first week after installation
-retention_1 - did the player come back and play 1 day after installing?
-retention_7 - did the player come back and play 7 days after installing?
When a player installed the game, he or she was randomly assigned to either gate_30 or gate_40.
The project aims to analyze the differences that we find in the variables of engagement(sum_gamerounds) and retention(retention_1 & retention_7); and test if these differences are significant.
MAIN FINDINGS
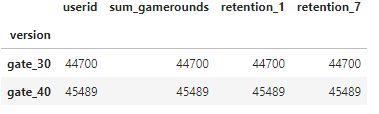
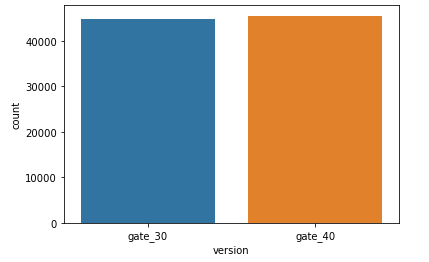
General view of the dataset:
The two groups are practically equally distributed(we have a small difference in favor of gate_40 users but it is not significant).
Let's move on to analyze the different variables separately:
Sum_gamerounds(engagement):
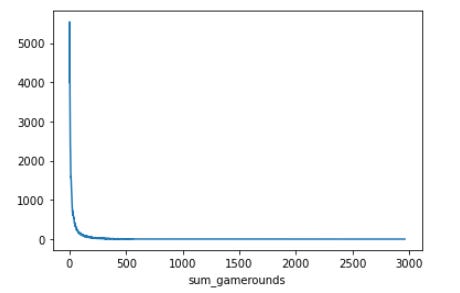

We can see that the vast majority of players that installed the game played less than 50 rounds. We resample the graph to the players that accumulated less than 150 games to have a better representation:
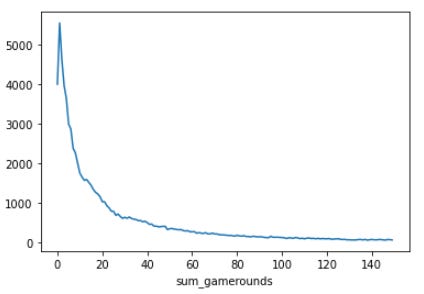
We can see that most players played less than 10 sessions or did not even play the game. Here we have a table with the sum of the players who have played each of the first 10 rounds:
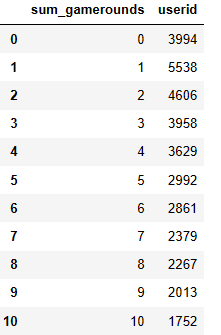
One and two rounds are the most common outcome. The general overview of the game is that most of the players play a small number of rounds.
When looking at the average sum of rounds for each group we have the following results:
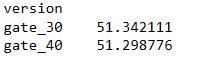
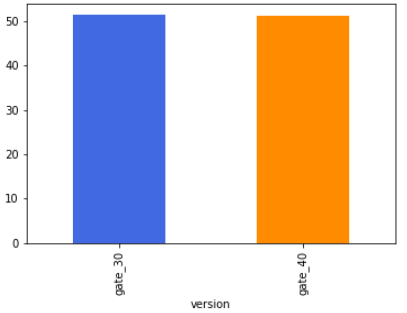
Practically we have the same sum of the number of rounds for each group. There is a slight difference in favor of the Gate_30 group, we will later test if this difference is significant. Let’s move to the retention variables.
We will review the retention after 1 day of installation and after 7 days of installation together:
How many players played after 1 day of installation? And after 7?
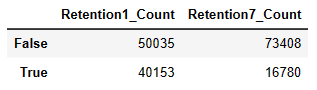
The ‘True’ row represents the player who did play, while the ‘False’ represents those that did not play. We have 40153 players who return to the game after 1 day of installation, and just 16780 of those players were still playing after one week.
Percentage representation to have a better overview:
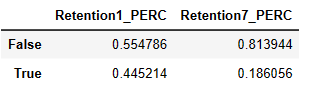
So, 44.5% of the players played 1 day after installation and just 18% of players were playing after 7 days. Let’s have a look at retention stats for each group.
Retention after 1 day of installing per group:
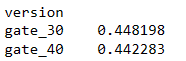
As we have seen with the sum of game rounds, Gate_30 group has a slightly better retention than Gate_40 group when looking at day-1 retention.
Retention after 7 days of installing per group:
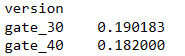
We have the same trend as with the other variables: A positive difference in favor of the Gate_30 group. In this case, the difference is bigger than in the other variables.
In conclusion, we see a downward trend in both the engagement and retention variables (something common in free-to-play games). The majority of the player base plays less than 10 game rounds. 44.5% of the players play 1 day after installation and just 18.6% still play after 1 week.
When looking at the different groups, we see small differences in favor of the Gate_30 group. Let's do an A/B test to see if these differences are significant.
A/B RESULTS
Here I am only going to analyze the test results and their meaning. In my Github (link at the beginning of the article) you have the whole process in case you want to review it.
I have done a T-Test for each of the variables. The null and alternative hypotheses are the same for each variable:
H0: Gate_30 == Gate_40
H1: Gate_30 != Gate_40
In case we do not reject the null hypothesis, it will mean that there is no significant difference between the two groups. In case we reject the null hypothesis, the difference between the two groups is significant. We will apply a confidence level of 95%.
Results:
-Sum_gamerounds:
P_value = 0.0508
We have a p-value higher than the threshold(0.05), meaning we can't reject the null hypothesis. So Gate30 and Gate 40 are not significantly different when looking at game rounds.
-Retention_1
P-value = 0.0739
We have a p-value higher than the threshold(0.05), meaning we can't reject the null hypothesis. So Gate30 and Gate 40 are not significantly different when looking at retention after 1 day of installation.
-Retention_7:
P-value = 0.0159
We have a p-value smaller than the threshold(0.05), so we reject the null hypothesis meaning that Gate30 & Gate40 are significantly different when looking at retention after 7 days.
In conclusion, there are no significant differences between the two groups when looking at total rounds played and retention after 1 day of installation. But, when looking at retention on day 7, we see that gate30 is slightly better than gate 40, and this difference is significant. For this reason, it is a better option to keep the current gate at level 30 and not move it to level 40.
EXTRA: BOOTSTRAPPING
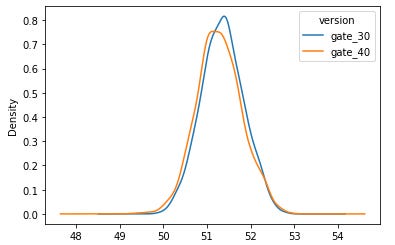
Let's use bootstrapping(re-sample the dataset n number of times) to plot how big the differences between each group for each variable are. I will first plot the mean of the two groups and then the difference between means with the probability of the Gate_30 group being greater for each variable.
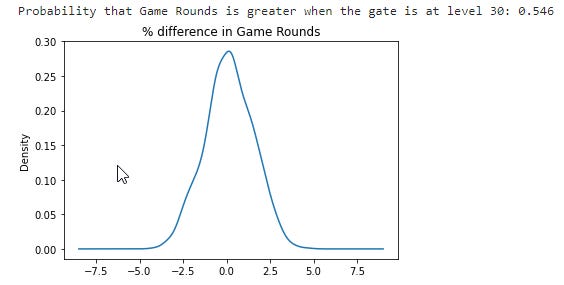
-Sum_gamerounds:
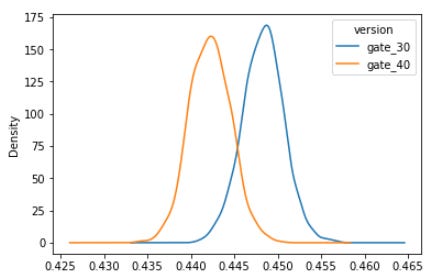
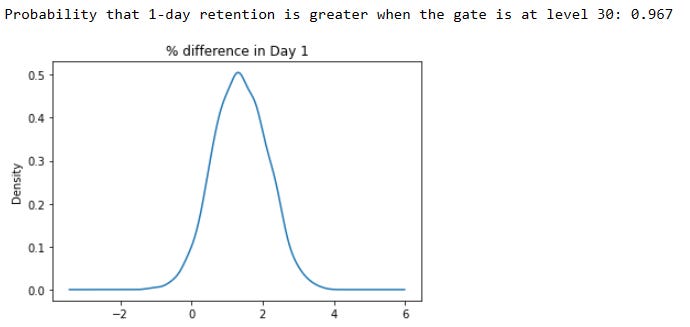
-Retention_1:
-Retention_7:
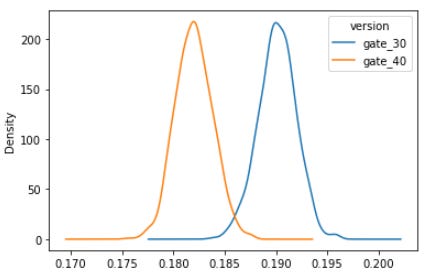
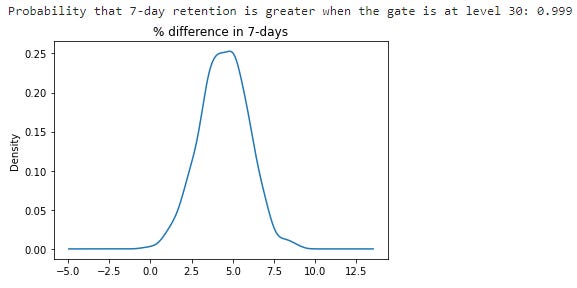
Conclusion: We confirm the same result we had when testing the significance of the differences. In game rounds, we see the least difference. In retention after 1 day of installation, we have a bigger difference but it is not significant. It is in retention after 7 days of installation where we see the bigger difference and we have tested that this difference is significant. When looking at the probability of Gate_30 being greater for each variable we have the following results: 54.6% in sum_gamereounds, 96.7% in Retention_1, and 99.9% in Retention_7. With all this information, we can say that keeping the gate at level 30 is the best option for the team.