
Designing a Game Economy System: A Deep Dive into Character Design and Loot Boxes
A Comprehensive Guide to Creating Game Economy design documents with Rarity-based Loot Boxes and 250 Unique Characters

On this blog, we've previously delved into data science(see this project or this one) projects and analyzed the economics of various video games(this project as an example). This time, I'm excited to share my latest work on game economy design. I've created three Excel documents that can form a part of a game economy system.
Before diving into the documents, I made a few basic assumptions about the game we’re working on:
PvP game where players fight in either 3vs3 or 5vs5 depending on the game mode.
There are 5 types of characters: Tanks, Healers, Fighters, Mages and Rogues
Characters can have 4 rarities depending on their overall strength, which is a combination of attributes and abilities: common, rare, epic and legendary.
Characters have 5 attributes, health, attack, crit rate, crit damage and armor, and a special ability.
Characters are unlocked through loot boxes.
The game also has a cosmetic economy for characters, with 10 different skins available for each character.
The game does also have ads as a source of revenue
To give you a better picture, the game would be similar to Brawl Stars, a mobile free-to-play multiplayer MOBA game with different game modes.
The first document I created is focused on character design. Since the game has 250 different characters, I designed five examples of different characters - one of each type - and created a ranking system for these characters based on their abilities and attributes. Next, I created a loot box system where each champion was assigned a monetary value, and I calculated the drop rate each character would have in the loot boxes. We will also simulate 100 loot boxes to see the results of our design. Finally, the 3rd document will be an A/B test. In this test, we will assume some players' behavior and test a change in the design of the ads.
CHARACTER DESIGN
To begin, we must first identify the different types of characters in the game. For our example, we have five different types of characters: tanks, healers, rogues, mages, and fighters. Each character has a set of attributes that define their abilities, including health, attack, crit rate, crit damage, and armor. Additionally, each character can have four different rarities, ranging from common to legendary, depending on the strength of their attributes and special abilities
The first step in creating our abilities and attributes system is to establish a ranking system for each attribute.
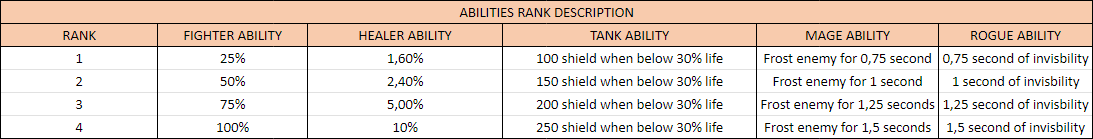
Here we have an example of 2 of the 5 attributes that each character has. We establish a range of values and then assign a rank for each range. We do the same for the special abilities of each champion. In this case, I have created 1 special ability for each character type.
Next, we assign a weight to each attribute and ability to determine their relative importance.
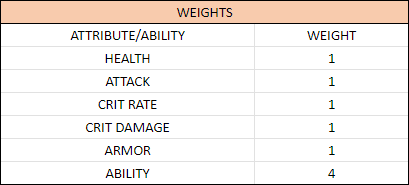
In our example, we created a basic weight system where attributes have a weight of 1, and abilities have a weight of 4. Depending on the game and the character, some attributes may have a higher weight than others.
Once we have established our ranking and weighting system, we can create our characters. In our document, we created five different characters, one of each type. For example, we designed a fighter character and a tank character, each with unique attributes and abilities.
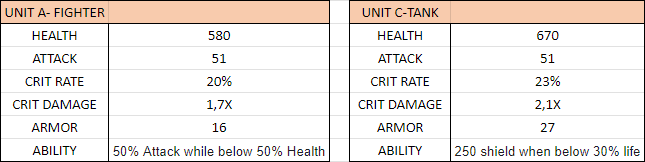
Now let’s calculate the rarity of a character using the fighter example. The first step is ranking the attributes and the ability by looking at the values the character has and the rank system we created before. For example, the fighter has 51 of attack, by looking at the attack rank system we created before(the first table in the article), we see that the 51 attack falls in rank 4. We follow this process for each attribute and ability. The final result for the tank character is the following:
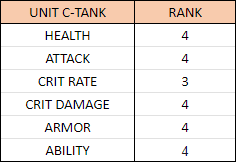
We see that this character has almost all the attributes and abilities at max rank. Probably this will be a legendary character. Let’s make some easy maths to calculate the character rarity. We start calculating the attributes and abilities in terms of their weight value. If an attribute/ability weight value is 1, we divide the rank by 4. If the attribute/ability has weight 4, we just add it to the total(this system gives all attributes/abilities weights values equal to 4, normalizing all the values).
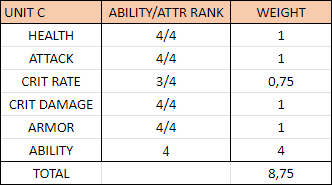
Finally, we divide the total weight of the attributes and abilities by 9 (the total weight value) and multiply the result by 4 (the number of rarities) to obtain the final rarity value for the character.
In our example, the tank character has almost all attributes and abilities at max rank, indicating that it is likely to be a legendary character. By applying our weight system and calculation method, we can confirm this assumption and obtain the final rarity value for the character.
LOOT BOXES
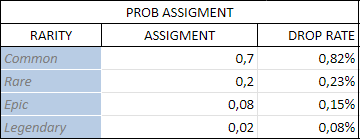
In this document we have the 250 characters ordered by rarity and type. I decided to calculate the drop rate and monetary value based on the rarity of the character. So, for example, a tank character will have the same drop rate and value than a mage character of the same rarity. I decided to assing a 70% of drop rate to common characters, 20% to Rare characters, 8% to Epic characters and 2% to legendary characters. Multiplying these probabilities with the number of characters of each rarity gives us the drop rates for each character. The result is the following:
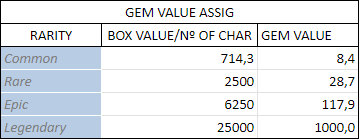
To calculate the monetary value of each character, we assumed that each loot box costs 500 gems (the hard currency of the game) and used this as an anchor value. We divided 500 by the probability assigned in the loot box and then divided this result by the number of characters of that rarity, resulting in the value per character. We used an IF function in the spreadsheet to assign the corresponding drop rate and gem value to each character.
With the loot box system designed, we created a fair system for issuing different characters based on their previously assigned rarity, which is directly related to their overall strength.
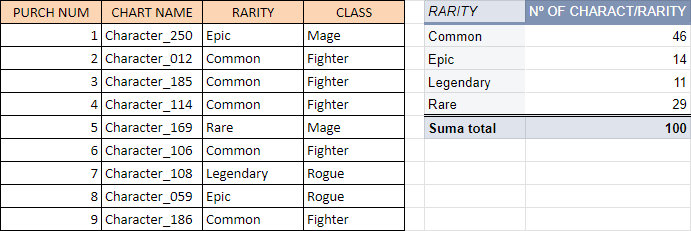
In the second spreadsheet, I have created a simulation of 100 box openings. we used VLOOKUP and RAND.BETWEEN to create this process. We also created a pivot table to analyze the different results of the simulation.
In the last spreadsheet, we calculated the number of days it would take a player to obtain a legendary character, assuming the game provides 1000 free gems per day and that each player can open 2 boxes per day with the free gems given by the game. We created a graph to display the results of this calculation. If you have any questions about the formulas used in these spreadsheets, feel free to DM me.
A/B TEST
The last document is an A/B test. I have assumed the following scenario: The game wants to increase the LTV(lifetime value) so we are doing an A/B test to increase the ads revenue. The two variants are:
Variant A: Display ads at the end of each song played and no two ads appear within 2 minutes
Variant B: Aggressively display ads at the end of each song played
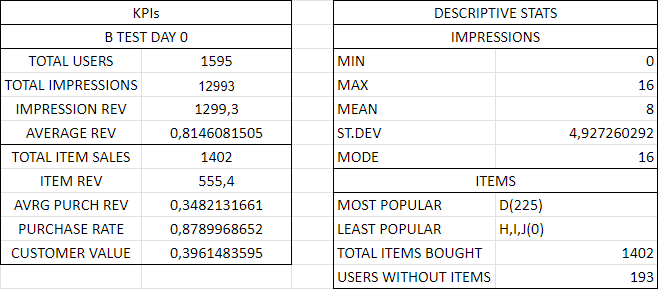
In the first spreadsheet, we have 2259 users assigned to test A and 1595 to test B. We have information about the userid, the variant assigned, the day of study(we have day 0 and day 1 but these are not consecutive days, day 1 refers to the day we decided the test has taken enough time), impression(number of ads impressions) and item bought.
The first step I did, was dividing the population by variant and day. So we have 4 different spreadsheets, A test day 0, A test day 1, B test day 0 and B test day 1. Once I have the population divided, I calculated some KPIs and descriptive statistics about the data as well as the sales of each item. This is what the analysis looks like:

After I analyzed each variant and day, I created a summary spreadsheet to calculate the differences between the two variants. The main results are:
In Variant A, users purchased every item from A-J(items are ordered by price; J items are the most expensive). While in Variant B users just bought from A-G.
Variant A had a higher revenue per ad than Variant B.
Customer value was also higher for Variant A
With all these results, we can conclude that variant A is a better option for the game. The next step could be to test the significance of the difference by running some hypothesis testing in Python (I have done a project where I actually do this).
CONCLUSION
In this article, we have delved into the world of game design and explored three important documents that are part of a game economy system. In the first two documents, we introduced a rarity system that ranks characters based on their overall strength and a loot box system that distributes these characters based on their rarity. In the third document, we took a data-driven approach and conducted an A/B test to analyze the impact of different ad variants on the game's revenue. Together, these three documents offer valuable insights into the complexities of game design and the importance of balancing player experience with revenue generation. By implementing these systems effectively, game developers can create engaging and profitable games that keep players coming back for more.